


Why Russell Volatility Rose And A Couple Of Portfolio Hedging Trades From Last Week
Weekend Review For Week Of December 11 - December 15

The Fed did what the Fed does and made the stock market happy last week. The big winner for the week was the Russell 2000 (RUT), which gained over 100 points or 5.5%. The other US indices had a good week as well with the Nasdaq-100 (NDX) up 3.35% and the S&P 500 up by a hair less than 2.5%.

Note, the Russell 2000 Volatility Index (RVX) rose last week in conjunction with the big move in the underlying index. RUT is so volatile that we have periodically seen panic call buying when the small cap benchmark rallies. One way to see if this was the case last week is to compare the implied volatility of out of the money (OTM) calls versus the implied volatility of out of the money puts. The chart below shows a consistent 30-day 105% (call) volatility measure divided by 30-day 95% (put) volatility.
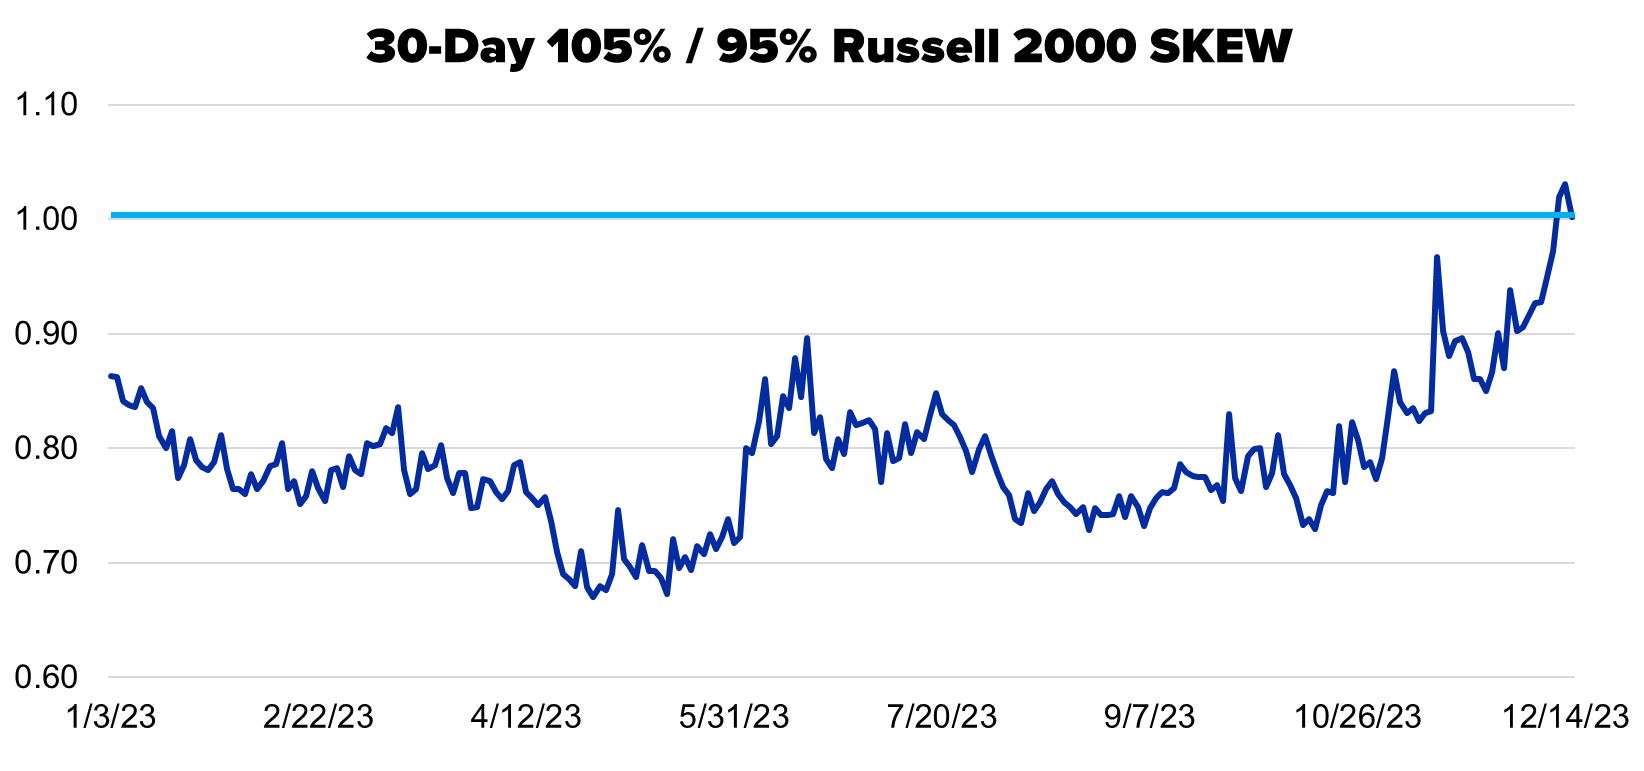
Note when the dark blue line is higher than 1.00, the call implied volatility is higher than comparable put implied volatility. That was the case over the past three days and accompanied a much higher RVX. The point here is do not think the market is more concerned about downside in the Russell 2000 than other indices solely based on RVX performance last week.
Turning to the VIX term structure, the December future, which expires on Wednesday, is in line with the spot index as traders believe we are in for a quiet couple of days in the market. January is at decent premium to spot, which means concerns about stocks are lurking in the new year.

The volatility related ETPs followed the VIX curve’s lead as SVIX was a big winner and UVIX a big loser. Soon we will be on ‘reverse split watch’ for UVIX as we already are for UVXY.

The European volatility term structure (VSTOXX) moved lower, with one contrast to its American cousin, the December contract finished the week at a slight premium to the spot index.

The one-day straddle performance was mixed last week. Starting with SPX the only tough day for options sellers was Fed-day (no surprise here) as the market greeted the final 2023 FOMC announcement with higher stock price. Of interest is the premium for Tuesday’s straddle. We got November CPI Tuesday before the open, a number that may have changed the outlook for Wednesday’s FOMC announcement. The result was the highest premium of the week and profit for sellers.

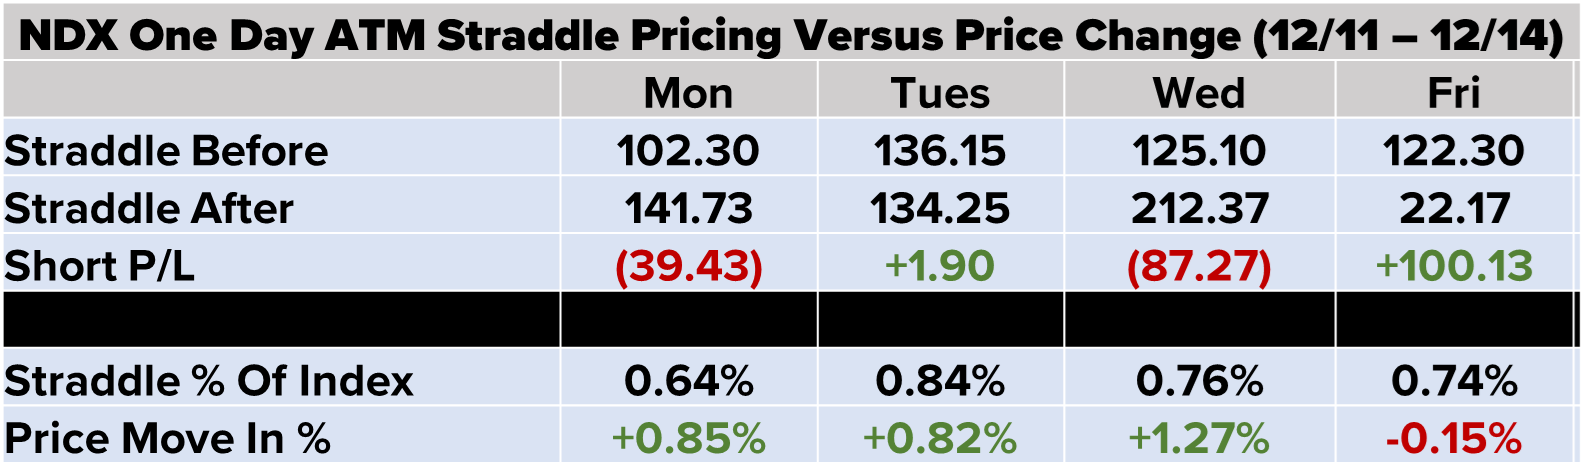
There is no NDX daily settlement on the third Friday of the month so only Monday through Thursday results appear on the table below.
NDX options underpriced the move on Wednesday, but also underpriced Monday’s 0.85% increase with the straddle pricing in an uncharacteristically low 0.64%.
EURO STOXX 50 (SX5E) straddles were five for five overpricing the following day’s move this past week. The premium ranges were as wide as we’ve seen since the late August launch of daily options (0.48% to 0.76%).

Finally, in our daily straddle universe DAX followed SX5E’s lead with overpricing five for five days last week, but the range of premiums was not quite as wide as that of DAX.

On Friday, we came across two trades that are guarding against a drop in NDX, using Nasdaq-100 Micro Index (XND) options. As a reminder, XND options are 1/100th the size of NDX. For example, if NDX is quoted at 16,600, the XND price will be 166.00.
The first trade is a collar, executed with XND at 165.94, sold 100 of the Dec 22nd 167 Calls at 0.76 and purchased 100 of the Dec 22nd 165 Puts for 0.71. The result is a credit of 0.05 and a payoff on the December 22 close that appears below.

Both the option spread outcome and spread combined with a Nasdaq-100 portfolio are depicted above. This collar is tight allowing for only 0.64% of upside or a loss of 0.57% over this five-day period. A safe assumption is the entity behind this trade wants to lock in profits with the index up over 50% year to date.
A second trade, which has an extra option leg and has a 3-month outlook was executed with XND at 166.24. This trade sells the XND Mar 15th 177 Call for 1.79, purchases the XND Mar 15th 162 Put for 3.11 and completes the trade by selling the Mar 15th 147 Put for 0.87 resulting in a net cost of 0.45.

Again, the payoff diagram has two different lines, one showing the option part and the other combined with long NDX/XND exposure. Right off the bat a bit of upside performance is sacrificed due to the cost of this trade, but in percentage terms it is only about 0.3% based on the premium versus XND at the time of the trade. This trade allows for portfolio loss of 2.82% if XND is between down 2.55% and 11.57% on March 15. Above 177, or 6.47% higher than XND at execution, gains are capped at 6.20%. Finally, there is extra potential downside if XND is below 147 at expiration.