VIX Over 30 Streak Comes To An End - Is This The All Clear For Stocks?
Weekend Review For Week of April 14, 2025 - April 17, 2025

VIX finished last week just under 30.00, closing under this level for the first time in ten trading days. Of course, the three-day weekend figured into the end of the streak, but the number is what it is. This is the twelfth time since 2000 that VIX experienced a streak of closing over 30.00 for ten days or more. This leads us to the click bait topic for this week’s review. Specifically, what does the stock market do once a VIX over 30.00 streak comes to an end.
The table below shows the performance for the S&P 500 (SPX) over a variety of time frames commencing with the first day VIX closed below 30.00. For sticklers, the number represents trading days.

There is a lot of green on the table above, especially for the longer time frames. However, out of context these figures really do not tell us too much. Therefore, we broke the numbers down and compared the end of streak performance figures to all time frames between 5-Days and 120-Days for SPX performance. The first table shows the percentage times when the market was higher over each time frame post end of VIX streak and all days.
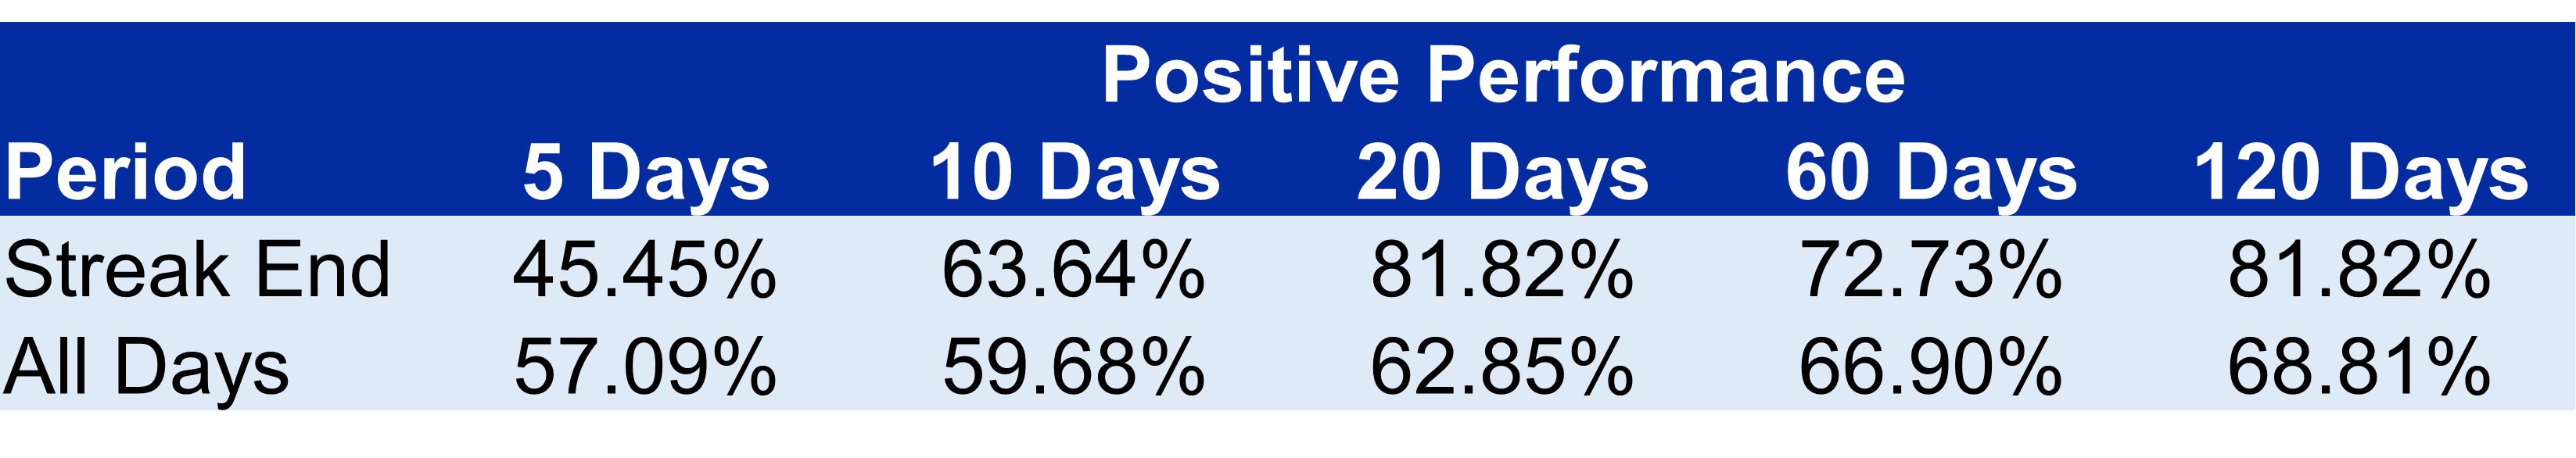
Over a 5-Day time frame, SPX was higher 45.45% of the time after the end of a VIX over 30.00 streak, while it was higher 57.09% over all 5-Day time frames. Note the figures for both time frames rise as the observation period is extended, but more so for the end of streak numbers. The next table shows the average performance for both scenarios.

Unsurprisingly, all time periods for both post streak and all time periods are positive. However, once we get past the 5-Day period, the performance differences widen significantly with 60-Day and 120-Day performance more than double that of average performance over all trading days.
The conclusion – historically the end of the VIX over 30 streak is followed by outperformance, but that outperformance takes a little time.
Earnings season sort of ramped up last week with five of the firms we follow reporting. For those that are new, we follow option activity on the stocks that were the highest fifty for the previous year and have at least 3 years of earnings data. We have started tracking the cumulative results and sharing them here based on four categories of market reactions to earnings. Basically, we are defining good and bad earnings based on the stock price reaction and not whether the EPS number was beat, etc.
We have four categories for earnings reactions:
· Strong – one-day stock price change is higher than the absolute average move over the last twelve reports
· Positive – one-day stock price change is positive, but less than the absolute average of the last twelve reports
· Negative – one-day stock price change is negative, but not more than the absolute average of the last twelve reports
· Weak – one-day stock price change is less than the low end of the absolute average of the last twelve reports
We stated that five of our companies reported, but one of them was Netflix, which reported after the close Thursday offering no reaction data yet. Of the four firms reporting, Bank of America (BAC) had strong earnings, Citigroup (C) and Charles Schwab (SCHW) had positive earnings, while Johnson & Johnson (JNJ) experienced a negative reaction. No stocks have had a weak response to earnings after two weeks of Q125 earnings reports. This leaves the results so far at two strong reports, three positive reports, and two negative reports.

SPX was down by 1.50% in less volatile activity than in recent weeks. The path VIX took, along with the holiday weekend impact, pushed it lower by almost 8 points. The Nasdaq-100 (NDX) had a tougher week than SPX and all eyes will be on it over the next couple of weeks as large components report earnings. Finally, small caps and European stocks finished the week solidly higher.

The VIX term-structure flattened as April expired and the spot index moved lower. We are still in the slightest of backwardation. For those considering buying the market these days, focus on the May VIX versus spot VIX relationship. The future below the spot indicates traders think VIX will drop further, which should be accompanied by a rise in stock prices.

The VIX related ETPs behaved as expected with SVIX leading the pack higher and UVIX coming under the most pressure.

VSTOXX worked lower last week, finishing at about a three-point discount to VIX. The VSTOXX term structure is flatter than VIX, and the index spread versus front month future narrower as well.

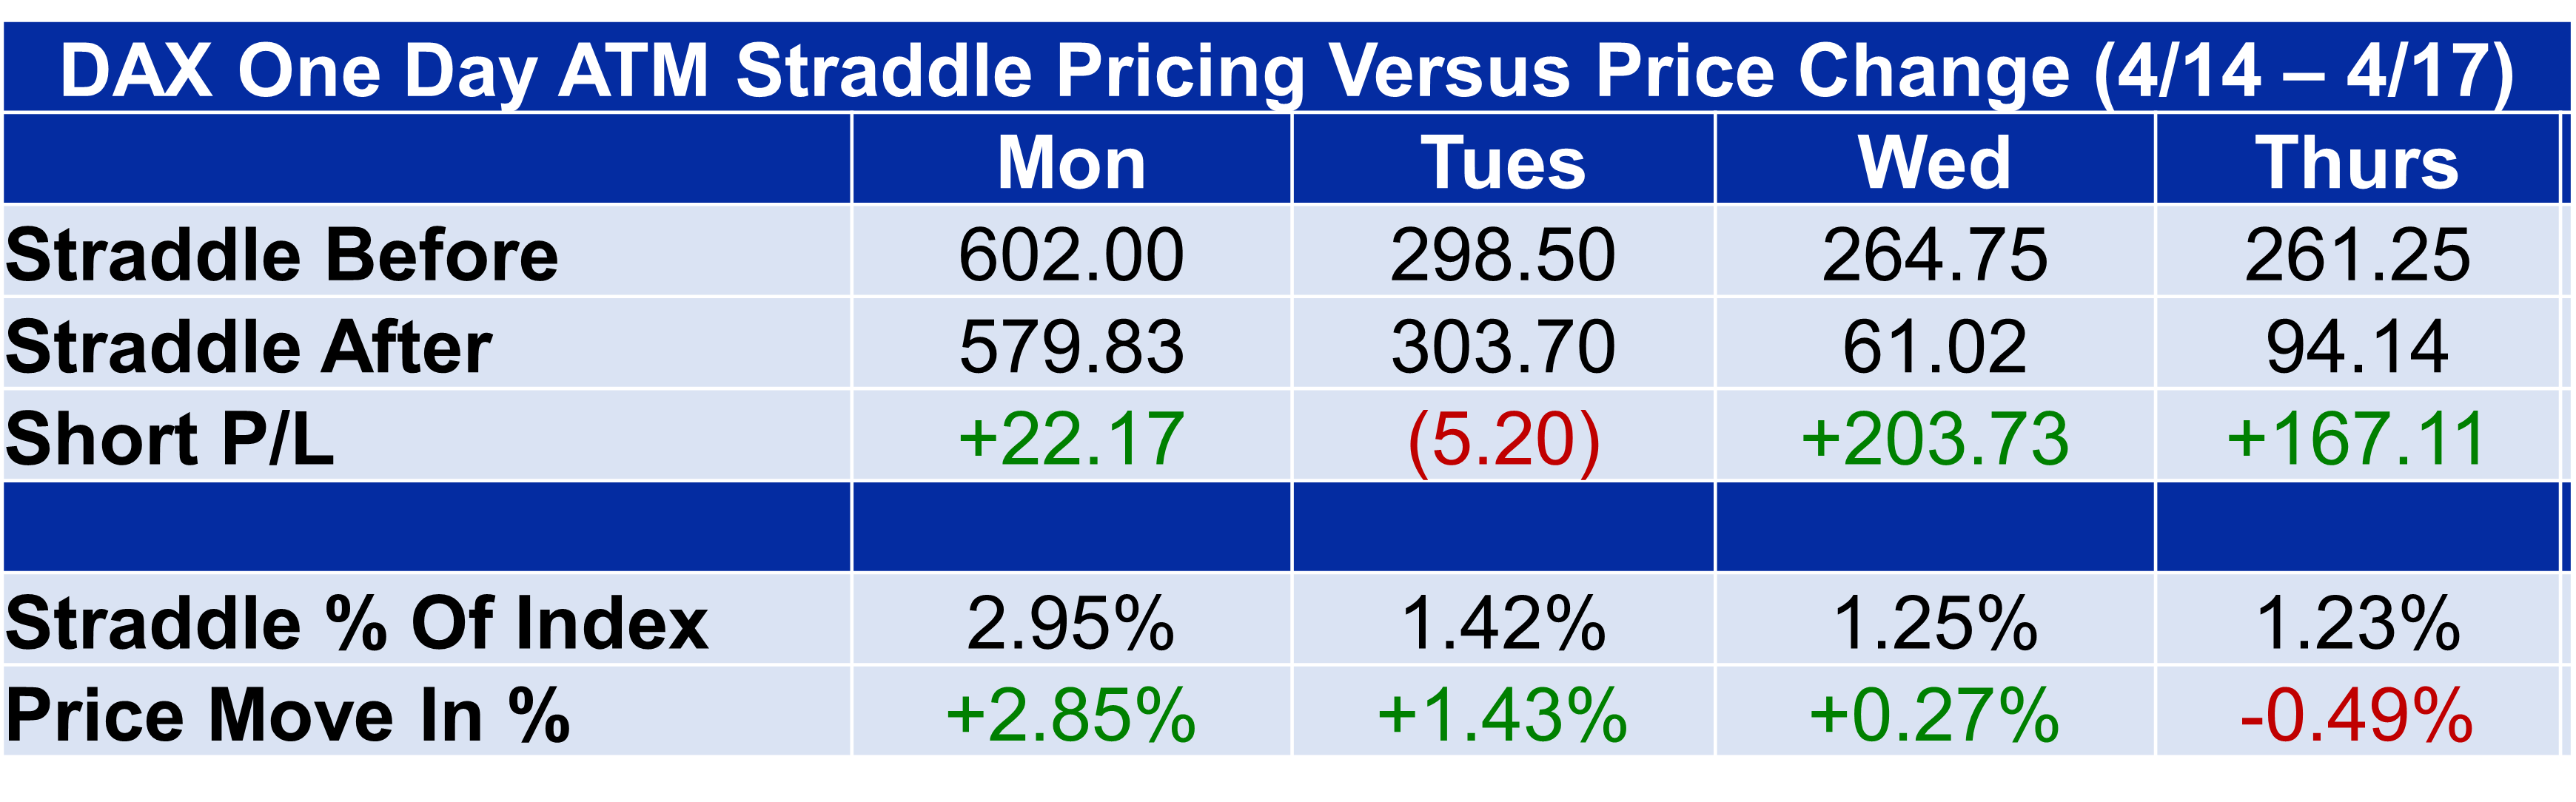
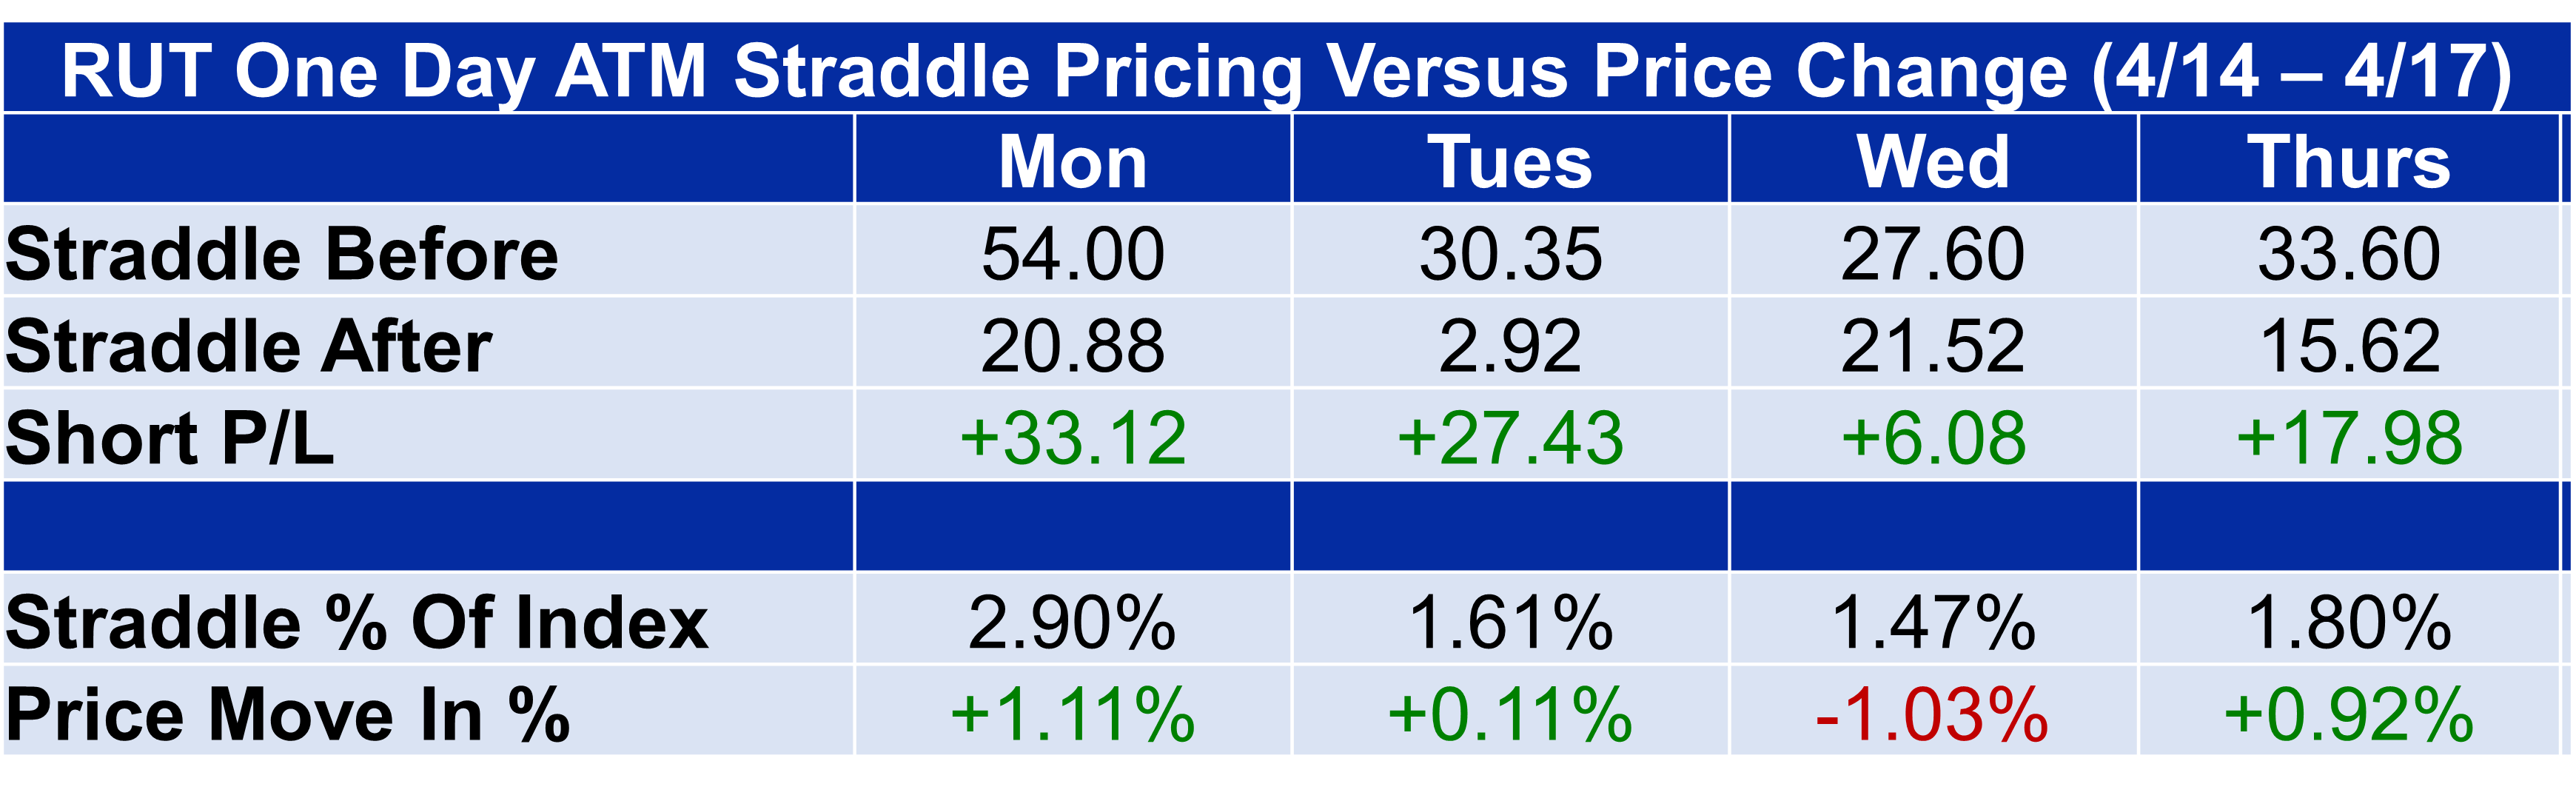
Finally, 1-Day index option sellers, if any have survived the past few weeks, were rewarded with a solid week. The at-the-money straddle underpriced the subsequent move on Wednesday, but profits from the other three days made up for Wednesday’s losses and then some.

Last week was a standard option expiration week so there are three NDX observations. NDX sellers went 2 for 3 with a net profit well over 300 points.

Russell 2000 (RUT) straddles were over-priced relative to the following day’s move all days last week.
Euro Stoxx 50 (SX5E) sellers were also perfect last week.

Finally, DAX just missed a perfect week with a 5-point loss on Tuesday.