


VIX And VSTOXX Term Structure Twists Plus A Look At EURO STOXX 50 1-Day Straddles
Weekend Review For 9/9/23

Stocks were under pressure in an orderly fashion as the S&P 500 (SPX), Nasdaq-100 (NDX), and EURO STOXX 50 (SX5E) all lost a bit more than 1%. Small caps were an outlier as the Russell 2000 (RUT) took it on the chin dropping 3.61% for the week. Earlier this year, specifically in June, we went long RUT and short SPX using the respective futures contracts. Our short stance on stocks is still in place, but we are going to get long RUT early next week, but at only 50% of our SPX short. Year to date the SPX is beating RUT by about 11% and we believe that spread should narrow in time.

VIX remains above the 2023 closing low of 12.91 and NDX underperformed SPX slightly, these two factors are the main reason we are short. If either factor changes, we will throw in the towel and cover the SPX short.
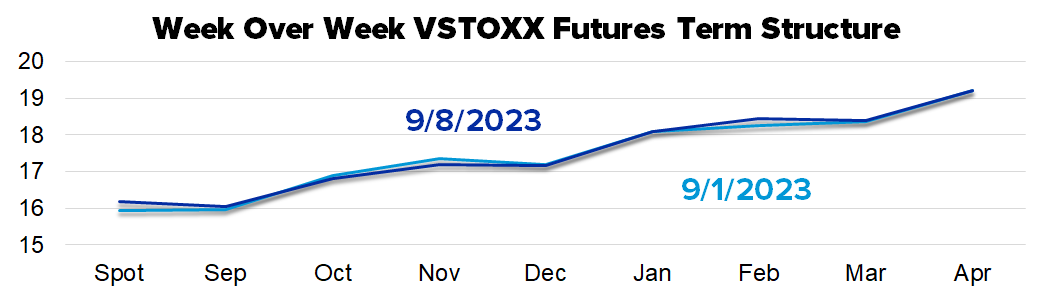
For some the term structure chart below may appear to be a single line as not much changed on a week over week basis in the VIX term structure.

Unlike Comet Nishimura, which is visible to the naked eye this coming week, the twist in the VIX term structure may not be. By twist we mean the short end of the curve was higher, while the long end of the curve moved lower. This is more apparent in the VIX related ETP performance on the table below.
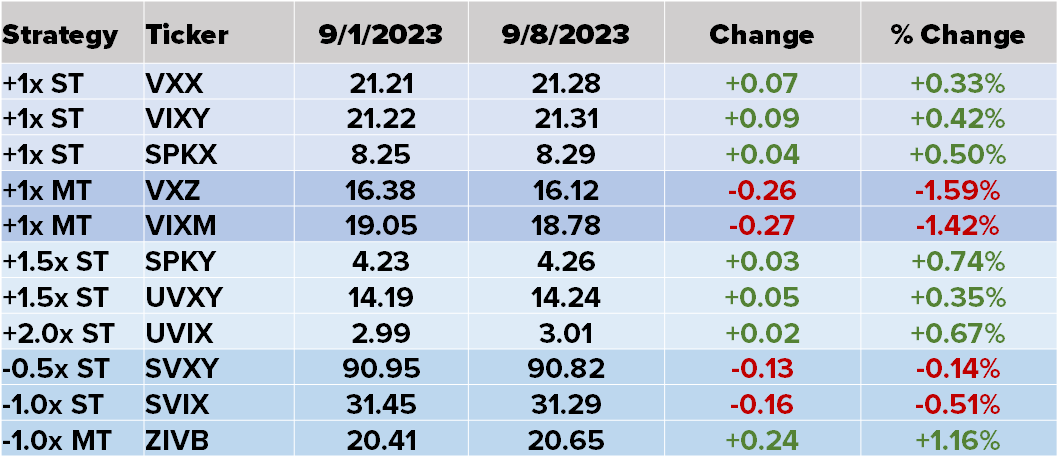
The short dated long funds and longer dated short fund (ZIVB) moved higher last week reflecting the price action in VIX term structure.
A final look at volatility takes us to Europe and the VSTOXX futures market which outdid the twisting with the short end higher, middle lower, and long end higher. In over a decade of watching volatility markets we can’t recall a twist like that in either VIX or VSTOXX’s term structure.
Turning to the short-dated index option market, the biggest move for SPX in the holiday shortened week was a drop of 0.70% on Wednesday. That was also the only day the straddle underpriced the following day’s move.

NDX’s big moves were Wednesday and Thursday with a drop of 0.88% and 0.73% respectively. Interestingly, those were the two days that a straddle seller would take a loss. Also, the straddle pricing for those two days was lower than the two days when NDX was slightly higher on the day.

This past week was the first full week of daily expirations in the EURO STOXX 50 Index option market and in response to this milestone we are including it in the review of 1-day ATM straddles.
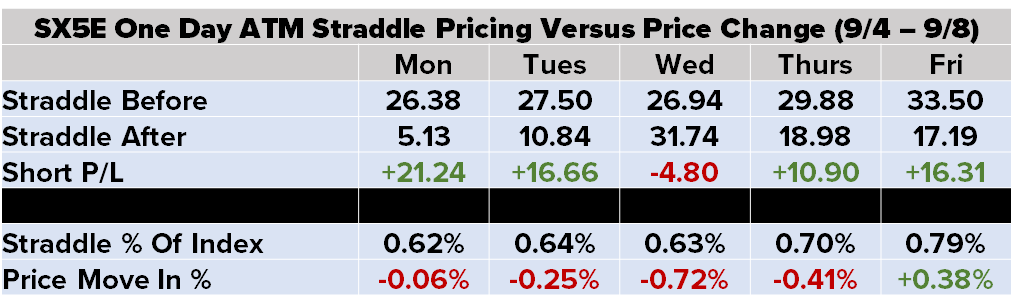
It was a very quiet week for the EURO STOXX 50, with no days experiencing a move greater than +/-1.00%. Based on the tame activity, the straddle over-priced the following day’s move four days and the one instance that the market moved more than the straddle pricing the result was a small loss for the straddle sellers.
The earnings calendar consisted of one of our stocks this past week, Gamestop (GME), and much like the rest of the market it was a yawner with GME shares moving up by 0.75% in response to earnings. The average move over the previous 12 quarters was +/-15.99%. The +0.75% move is small compared to that number, but there was a smaller reaction of +0.19% for Q2 2022.
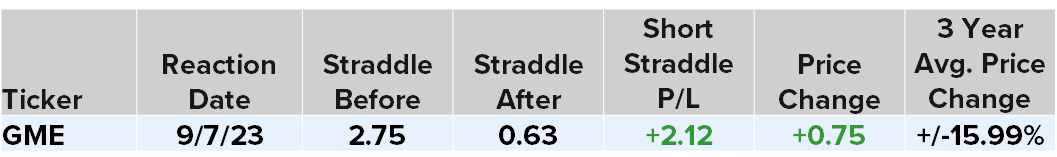
Also, we get many questions about the source of earnings data (we’ve been compiling it for years) and the process. One question is, “How do you choose the ATM strike price is the stock price is exactly between two strike prices?” GME closed the day before the earnings reaction at 18.75, placing it right in the middle of the 18.50 and 19.00 strike prices. We default to the previous day’s close and use the higher strike price if the stock closed higher the previous day or lower strike price if the stock closed lower the previous day. In this case, the 19.00 strike was chosen based on the previous day’s close of 19.23.