Flat Term Structure May Signal Excess Volatility Despite Lower VIX
Weekend Review For Week of May 5, 2025 - May 9, 2025

Both the S&P 500 (SPX) and Nasdaq-100 (NDX) were slightly lower last week while the Russell 2000 (RUT) managed a small increase. The indices’ respective volatility counterparts were all lower, with VIX finishing the week slightly higher than close the day of Trump’s initial tariff announcement.

As noted in this week’s headline, the VIX term structure is very flat with the spot index through seventh month (November) futures contracts all within a 0.25 range. Historically we have considered a flat VIX curve to indicate heightened uncertainty with respect to the direction of VIX and SPX.

We gathered VIX and respective VIX futures data starting with the first day of 2011 through this past Friday. This consists of 3,587 trading days and there have only been 102 instances of VIX and the front seven VIX futures closing range falls within a point. Three of those observations are recent (May 2, May 8, and May 9) so the historical analysis excludes those three observations.
We are crunching numbers regarding the information content of the VIX term structure, but there appears to be a signal that the markets will be more volatile over the near term after a day when the term structure is flat. For example, the average move over the following five days after a flat term structure is +/-2.07% versus an average move of +/-1.61% over all five trading day periods. This spread widens when considering the following twenty trading days, with the average SPX move +/-4.81% versus +/-3.22% over all twenty-day periods from 2011 through present.
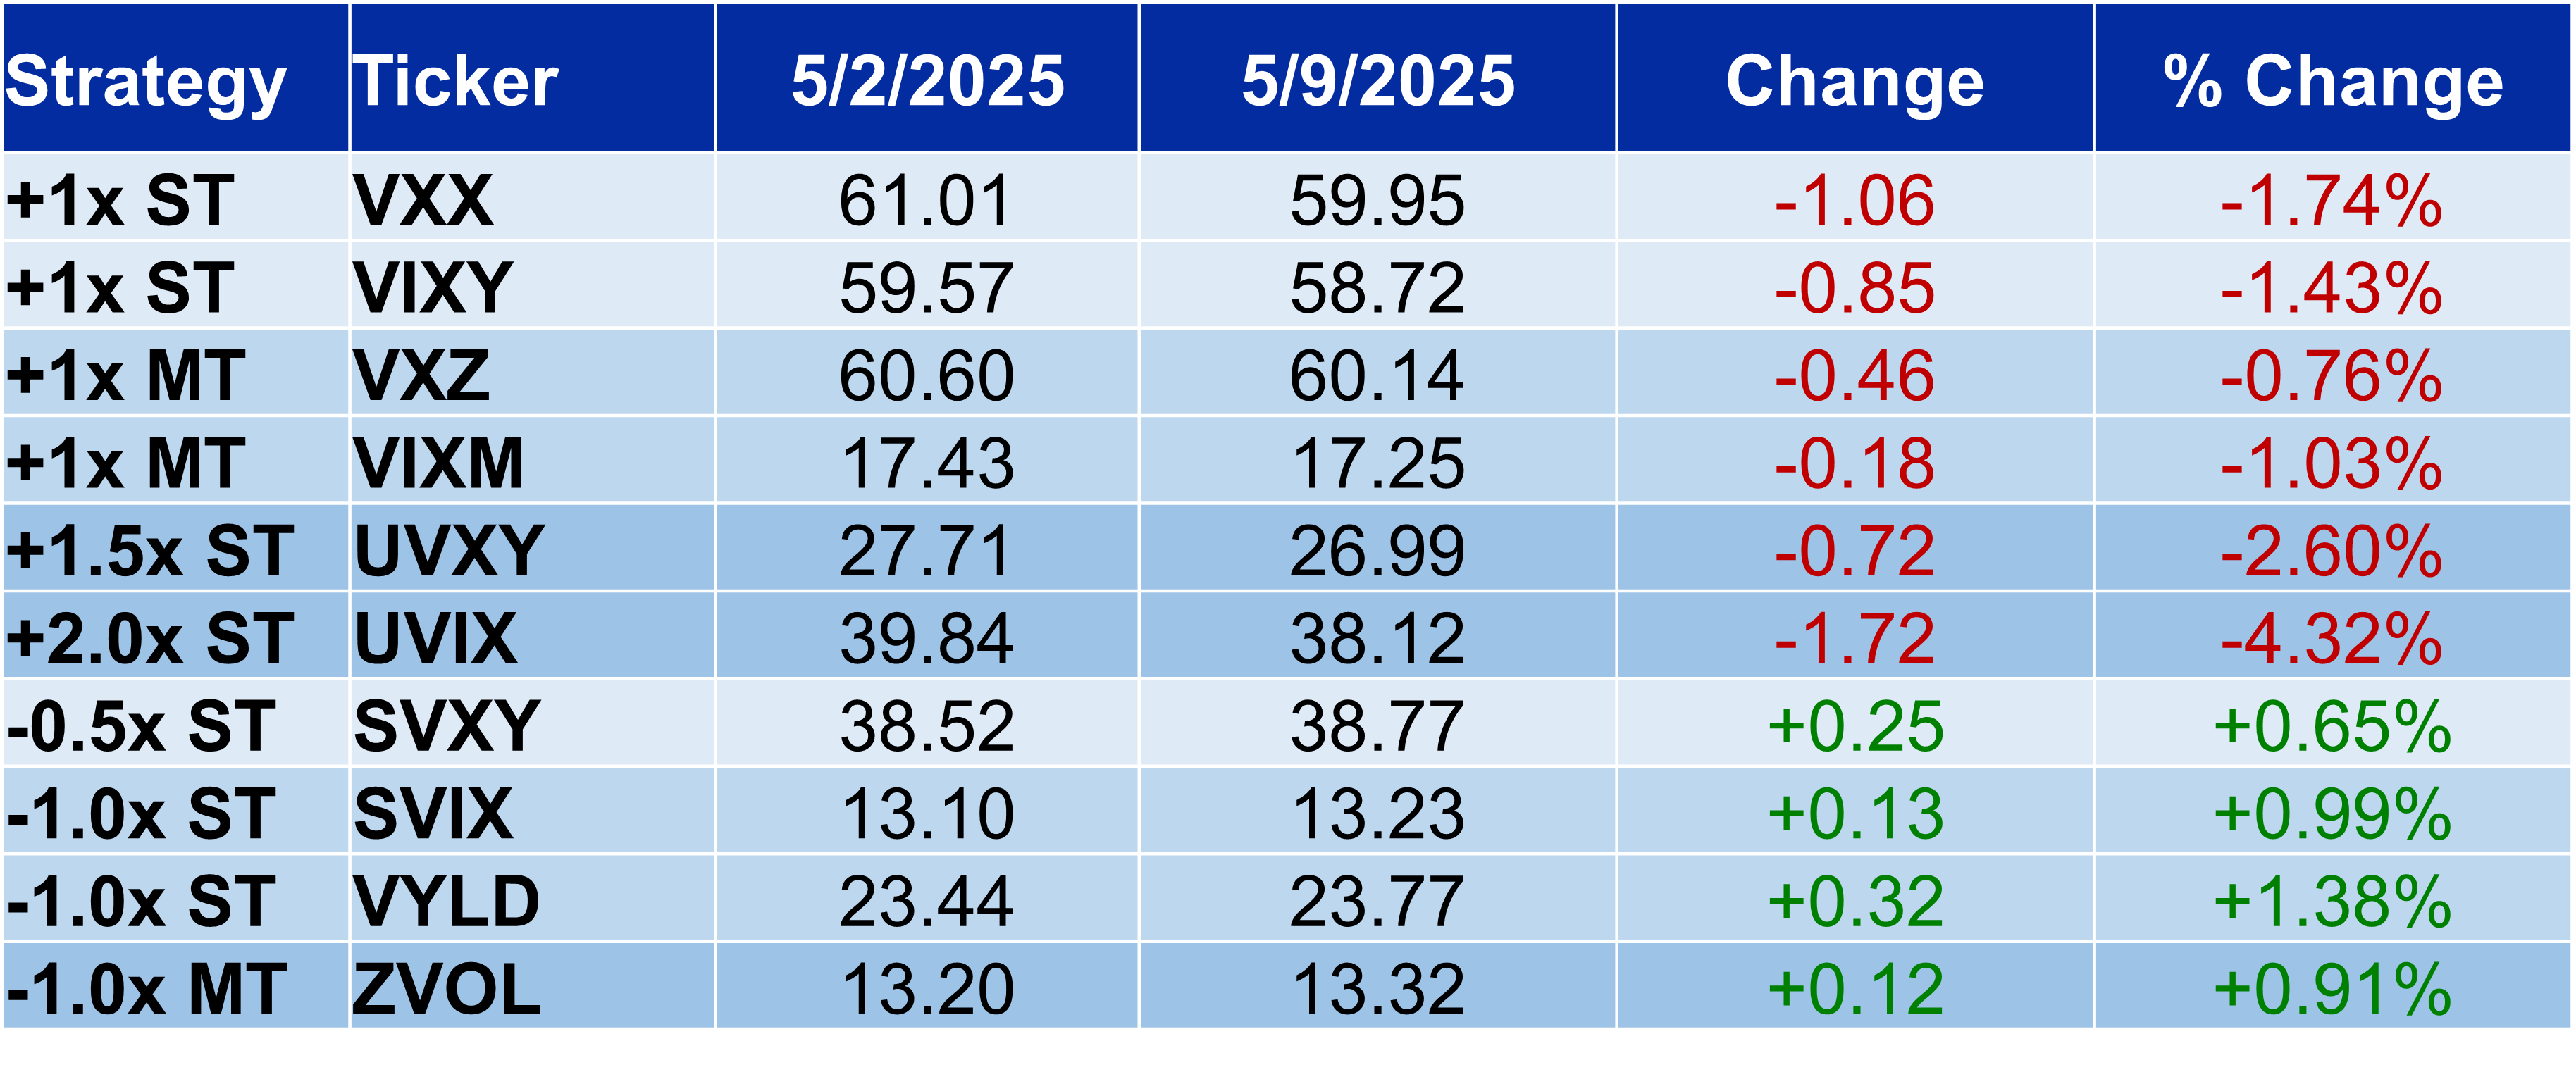
The VIX-related ETPs have put up interesting numbers in the past few weeks as the term structure changes have been a bit unconventional, but that was not the case last week. The short funds were higher, based on the drop in spot VIX and the associated futures. The big winner last week was the upstart VYLD, gaining 1.38%.
The VSTOXX term structure is not in the same tight range as VIX. Also, the week over week changes were mixed versus the uniform drop in the VIX market.

We have started tracking earnings season performance in the fifty stocks we track. We define earnings reactions based on the stock price reaction relative to a stock’s historical reaction over the past three years. We have four categories for earnings reactions:
Strong – one-day stock price change is higher than the absolute average move over the last twelve reports
Positive – one-day stock price change is positive, but less than the absolute average of the last twelve reports
Negative – one-day stock price change is negative, but not more than the absolute average of the last twelve reports
Weak – one-day stock price change is less than the low end of the absolute average of the last twelve reports
The stock reactions last week by category:
Strong - DIS, OXY
Positive - F, AMD, PARA
Negative - UBER
Weak - None
As of this week, thirty-seven of the fifty stocks we follow have reported and most of those reports have been strong or positive. Only two truly negative reactions have occurred with ENPH and QCOM experiencing downside moves that exceeded the average price change on earnings day.

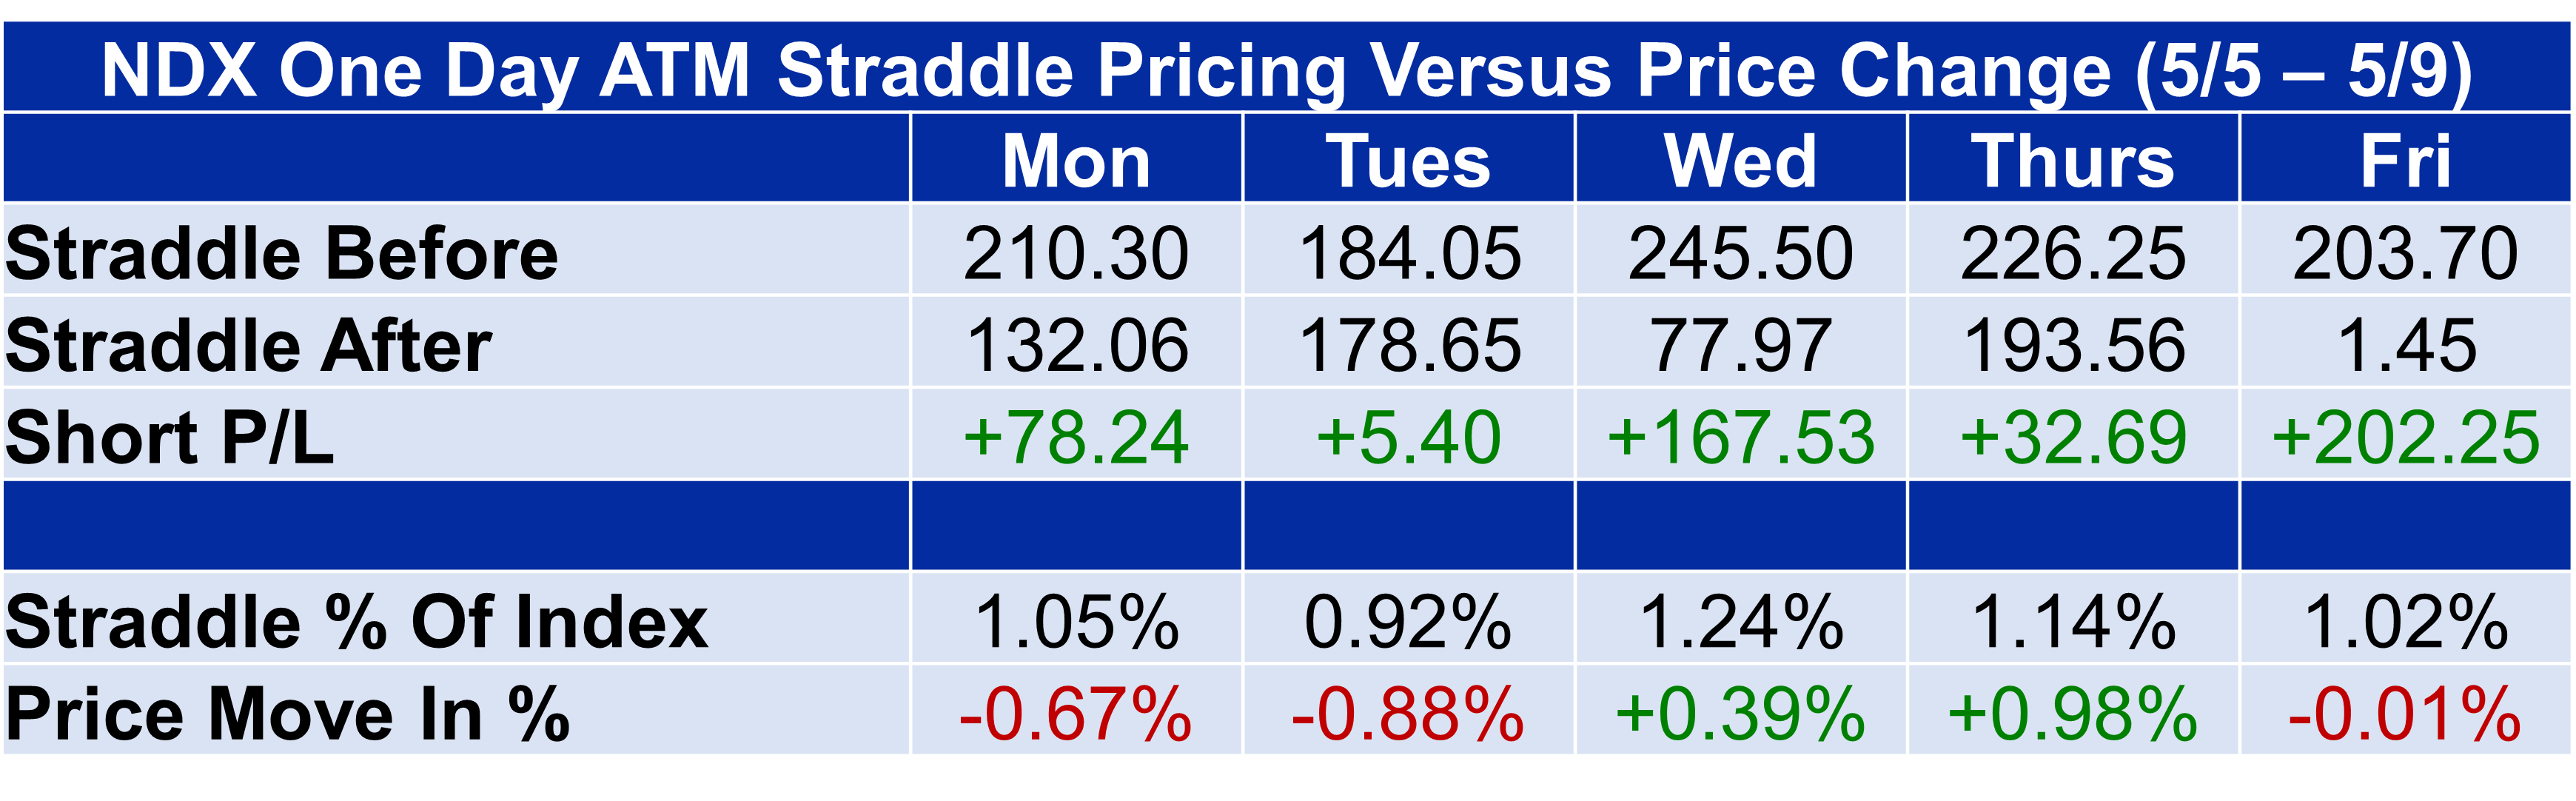
This year has been a tough one for index option sellers, but last week offered opportunities to make some losses back. Sellers of 1-day at-the-money straddles in SPX and NDX profited five days last week, while RUT sellers went three for five, but made a net positive profit.


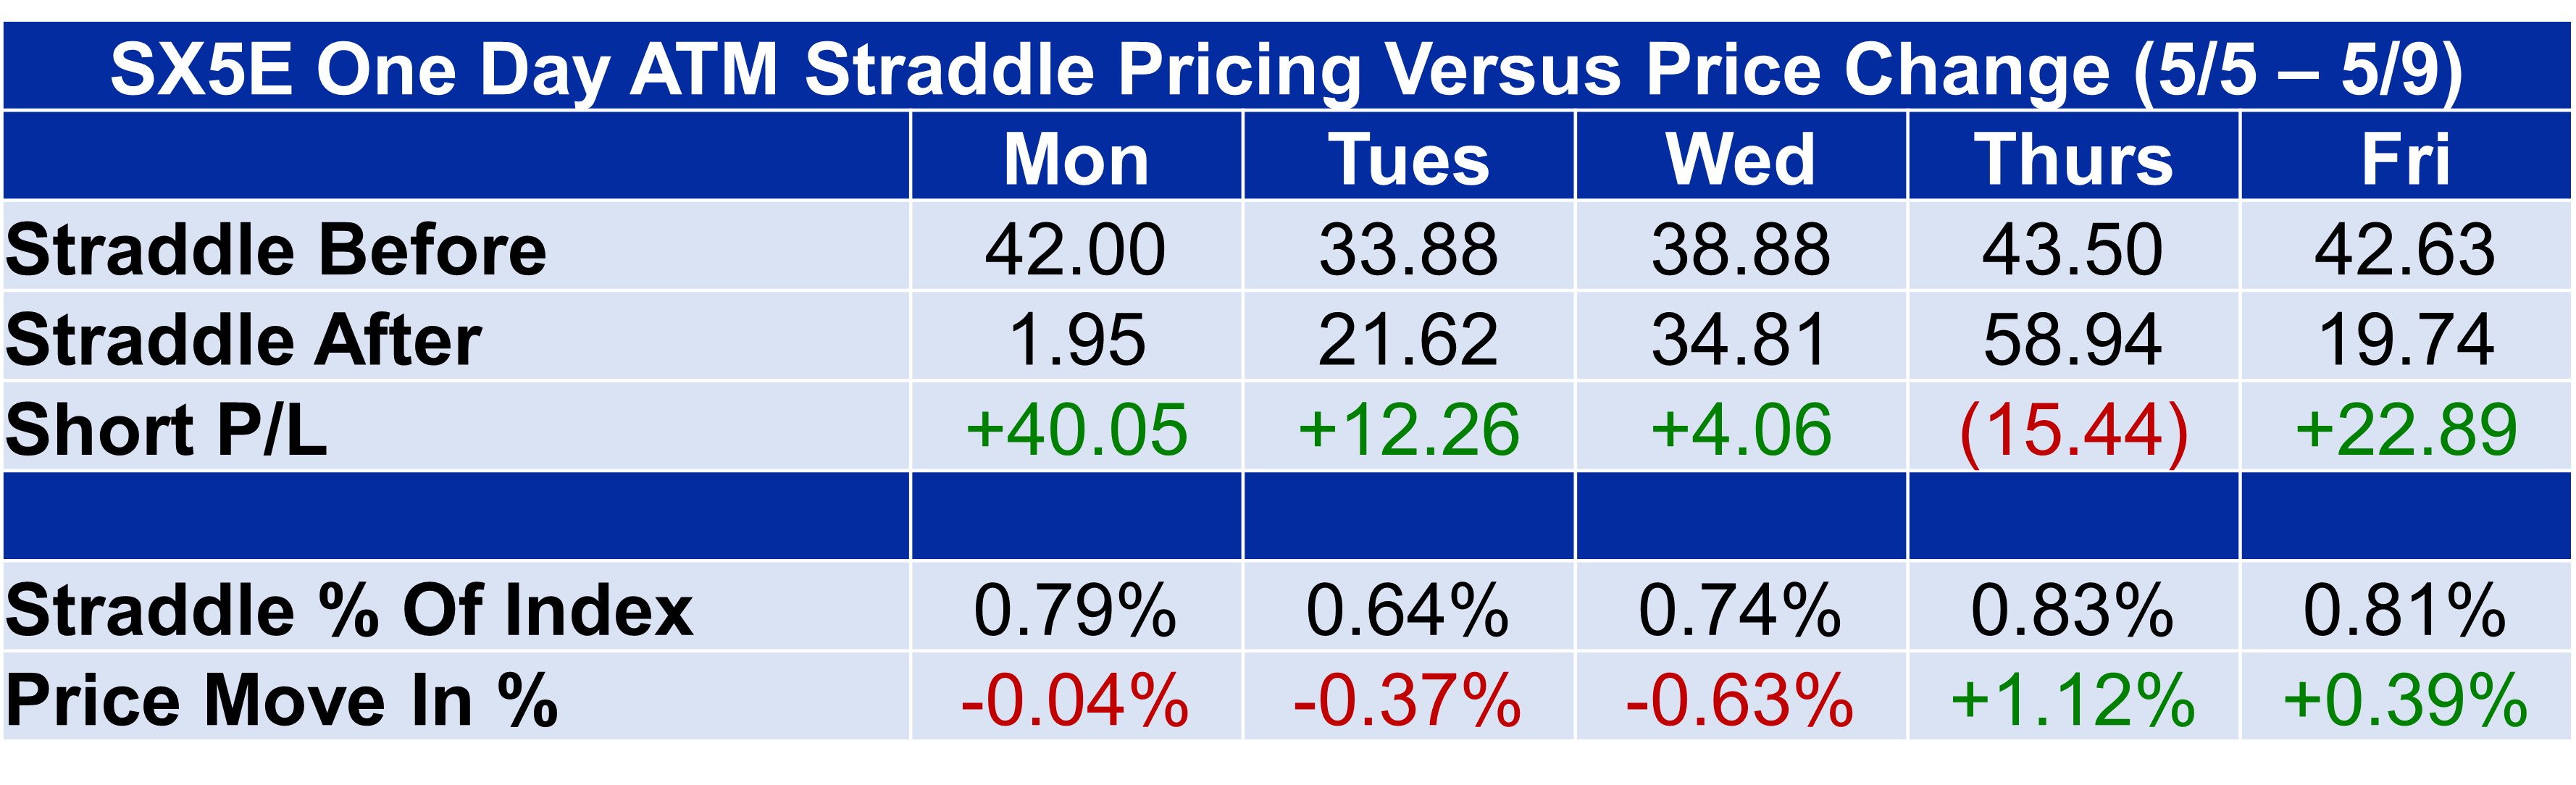
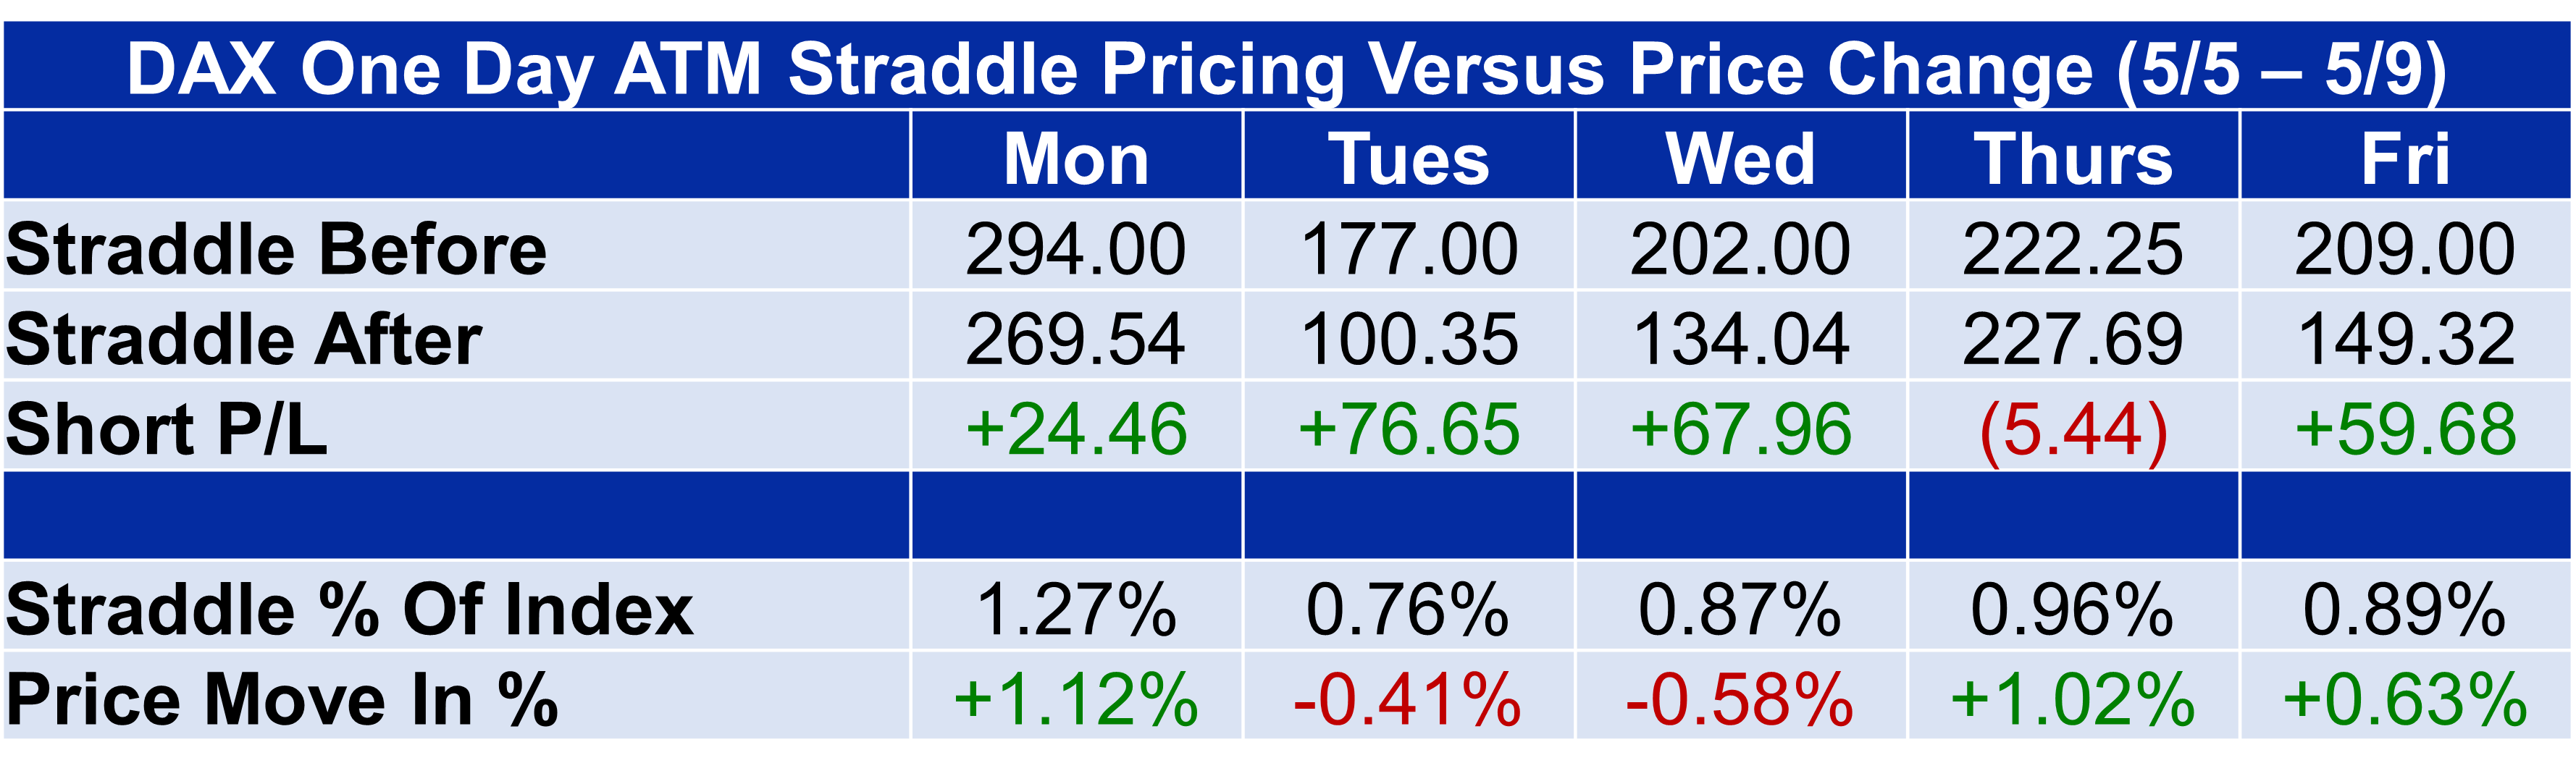
Finally, European index option sellers did well last week with both the Euro Stoxx 50 (SX5E) and DAX options overpricing the following day’s move four of five days.