


Digging Into 1-Day SPX At-The-Money Straddles

Anyone with even a passing interest in the option markets is aware of the dramatic increase in index option volume over the past couple of years. A good portion of this growth is attributed to short-dated S&P 500 (SPX) index options. There are now expirations on the close each trading day for SPX options. This led us to explore the price behavior of these options through analyzing the performance of 1-Day at-the-money (ATM) straddles using SPX index options.
Research Method
Our method involved using the mid-point of the put and call with the closest strike price to the SPX close. This is commonly referred to as the ATM straddle. We compared the straddle premium to the following day’s closing price. This allows us to determine if the straddle overpriced or underpriced the following day’s move. Our data source is Cboe LiveVol and the calculations were made by the author.
We calculate a hypothetical profit or loss based on selling and buying the straddle. In each case we applied slippage of 1.00 point. This accounts for commissions and execution relative to the mid-point of the straddle spread.
Results
Over the 14-month period from January 2022 to February 2023 there were 259 days with SPX options expiring on the close. The first table is an overview of pricing 1-Day SPX ATM straddles the day before expiration and holding the position into the following day’s close.
The table contains a variety of data. For clarity we briefly explain each column below.
Avg ATM % – the average of the ATM straddle price as a percent of the SPXclosing price
ABS Avg. Price % – the average price change (higher or lower) as a percent of SPX on observation dates
Observations – the number of PM expirations for SPX option markets over the 14-month time period
Inside Range – this figure shows the number of occurrences when SPX closed inside the range priced by the ATM straddle. This observation does not include any trading costs.
% Inside – the percent of observations where SPX closed inside the range priced by the ATM straddle.
Short Straddle Profit / Loss – profit or loss based on consistently selling the relevant straddles including 1.00 point slippage and commission costs.
Long Straddle Profit / Loss – profit or loss based on consistently buying the relevant straddles including 1.00 point slippage and commission costs.

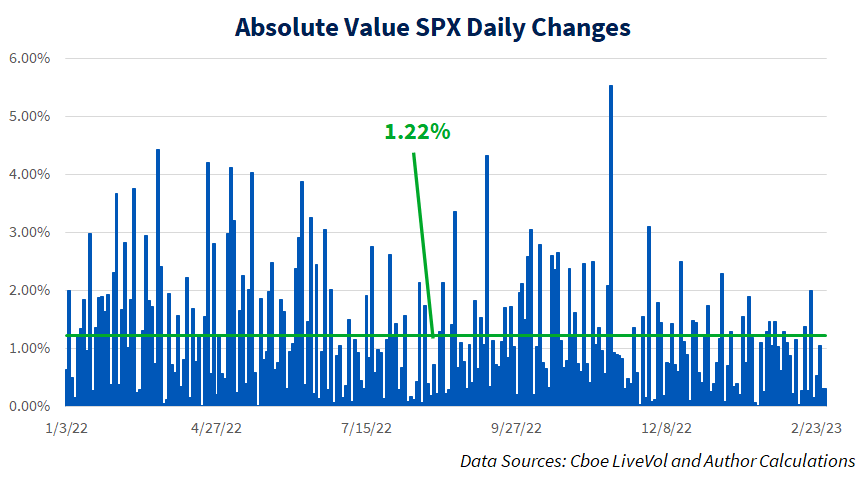
The average 1-Day straddle pricing was 1.13%, while the average price change on days where 1-Day SPX options expired was +/-1.22%. As noted earlier there were 259 observations and the closing for SPX fell in the 1-Day straddle range 145 of those days or just under 56%. Finally, recall there is slippage incorporated into the P/L statistics which resulted in losses for both short and long straddle positions. Without commissions a straddle buyer would have made a profit of about 35 points while a seller would realize the opposite of that figure.
We charted both straddle pricing and the absolute value of daily price moves which appear in the following two charts. First, the straddle pricing averaged 1.13%, but there is range of pricing that varies from as low as 0.48% to a high of 2.39%. Many of the higher levels on the chart is associated with the SPX straddle the day before the Consumer Price Index, Employment Situation Report, or FOMC announcement.

The actual price changes on days where SPX options expired on the close appear below. This data is more volatile than the anticipated price changes based on straddle pricing. The average price change as +/-1.22%, with the lowest change coming in at 0.01%. The biggest SPX move over this time frame was 5.54% on November 10, 2022.
We also broke out the performance of a hypothetical strategy consistently selling and buying a 1-Day straddle in the following two charts. The first one shows the performance of taking a short straddle position and holding it into the following day’s close.
Shorting a 1-Day SPX straddle worked well for the first couple weeks in 2022, but then performance consistently trended lower, before moving higher, and then resuming the downtrend through November 2022. Earlier, it was noted that the biggest price move was 5.54% on November 10, 2022. That day also marked the low on the short straddle performance chart.
The long straddle chart is more volatile than the short one as there are a few days where SPX experienced a large one day price change. This is reflected in a couple of quick moves higher below. The long straddle performance finished on the low on the chart below which is a likely a result of very few outliers in the stock market over the first two months of 2023.

Finally, we broke down the results by the day of week for each expiration and this data appears in the following table. The data was interesting with respect to a divergence among different days. The weekday column represents the day of week the option expires, not the day the straddle was priced.
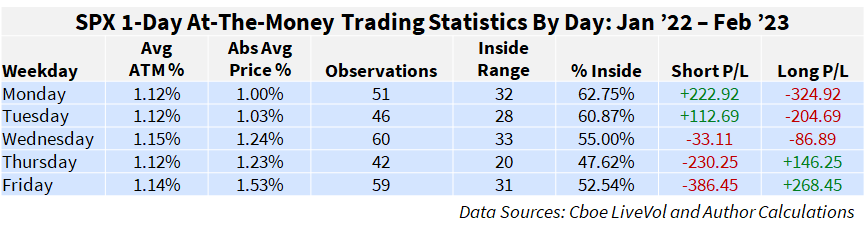
The average pricing of a straddle was very consistent across each day of the week. However, the price changes were not. The average straddle pricing ranges from 1.12% (Monday, Tuesday, and Thursday) to 1.15% on Wednesday. The Wednesday data may be skewed higher as FOMC releases occur on Wednesday. Also, the slightly higher Friday figure (1.14%) may be attributed to the monthly employment situation report that is usually released on the first Friday of the month. The average price move by day is lowest on Monday (1.00%) and highest on Friday (1.53%) this divergence impacts the remaining data on the table.
There are slightly fewer observations on Tuesday and Thursday as those expirations were not available at the beginning of 2022. Note the Inside Range and % Inside data reflect the Abs Avg Price % data as on Monday and Tuesday the price change fell within the range priced in by the straddle over 60% of the time. This figure drops to 55.00% on Wednesday and under 50% on Thursday. Friday’s result is slightly higher at 52.54%.
Finally, the Short P/L and Long P/L columns tell a very interesting story. On Monday and Tuesday, on paper, consistently selling a straddle would result in a nice profit. Wednesday straddle selling and buying results in losses, mostly attributed to the cost of trading, while long straddles shine on Thursday and Fridays. This by no means is a recommendation to sell straddles early in the week and buy them later in the week but is an interesting observation on overpricing and underpricing subsequent price moves by the SPX option market over the course of a week.