Did VIX At 65 Count? Maybe Not...
Saturday Review For Week Of August 5, 2024 - August 9, 2024
Usually I kick off with a quick review of the previous week in this space, but I’m so excited about a VIX discovery that I’m making it the lead.
So last week everyone got excited as the official high for VIX on Monday registered at 65.73, a figure that has rarely been seen for VIX. However, that print occurred about an hour before regular trading hours in the US. A quick look at an intraday chart shows the highest level for VIX between 9:30 and 4:00 (regular stock market hours) was 55.68.
As a reminder, VIX is calculated using the mid-point price of the bid-ask spread for SPX options. During a less liquid time for the markets that spread may be wider than during periods of more volume. SPX options trade during extended hours, overlapping with European market hours, and it is a liquid market with plenty of volume. But outside of regular trading hours the quoted spread for SPX options may be wider than during regular trading hours and the wider spreads can result in a higher quoted VIX. Based on all these thoughts, I did some digging with respect to the VIX quote from 3:00 am to 9:30 am versus VIX action from 9:30 am to 4:00 pm.
We have overnight VIX data going back to April 15, 2016, or for 2,094 trading days. On those days, the high for VIX occurred during the premarket hours 803 times or just over 1 in 3 trading days. Conversely the low for VIX only occurred 38 times over this period. Finally, there were 14 trading days where both the high and low for VIX was recorded during non-standard hours.
The point is that VIX likely gets a boost from wider SPX spreads during non-standard hours. Keep in mind, when a market maker widens their bid-ask spread, the bid can only go as low as 0. In the VIX calculation, if the bid goes to 0, the SPX option is not included in the calculation. If a market maker raises their offer, it does provide a small boost to VIX and it is quite possible that this behind-the-scenes activity is responsible for Monday’s VIX high over 65.00.
Now on to the markets. On a weekly basis the S&P 500 (SPX) was down 0.04%, a figure that does not tell the story of last week. At one point I was getting the typical, “is it time to sell” calls that accompany sell offs. The Nasdaq-100 (NDX) managed a small gain and Russell 2000 (RUT) was the big loser giving back 1.35%. Volatility indices were all elevated going into the week and gave back some of the previous week’s gains.
The short end of the VIX term structure is in backwardation with both August and September at a discount to spot VIX. The drop in September is particularly interesting as that’s often considered a treacherous month.
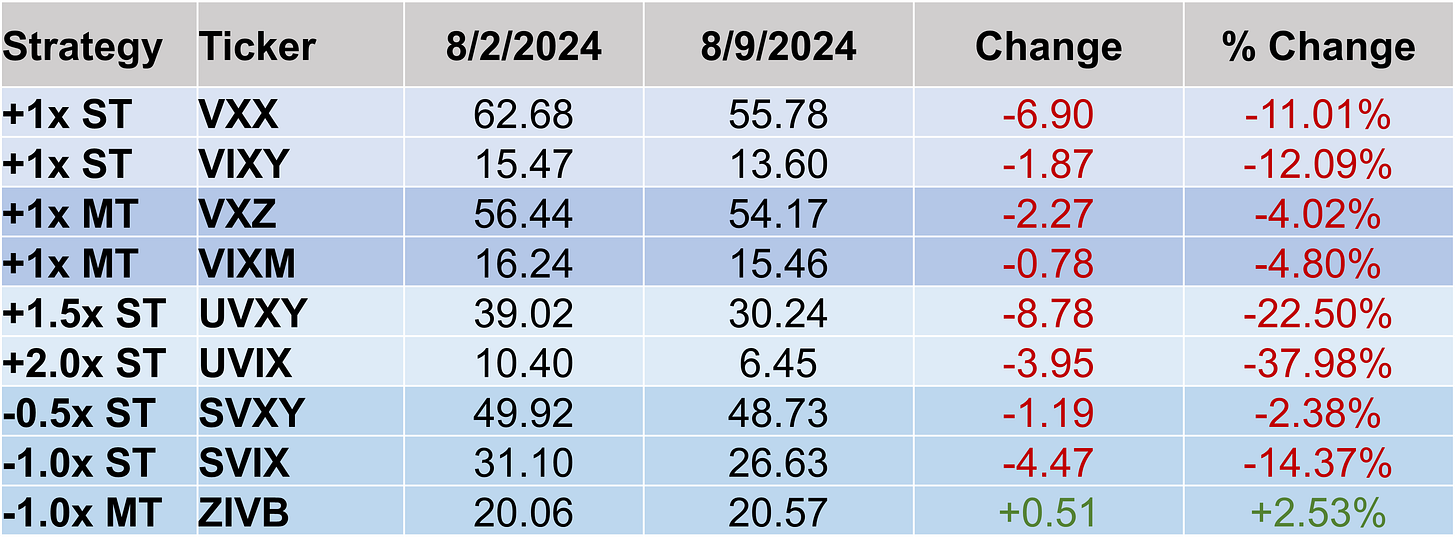
VIX ETPs offer daily performance based on specific VIX futures pricing. Sometimes, when the market is excessively volatile both long and short VIX funds can lose value. This is a bit rare but did happen last week as only the ETP offering inverse performance of the fourth through seventh month futures (ZIVB) managed positive performance.
VSTOXX dropped more than VIX last week and the VSTOXX term structure was flatter than VIX as well. The bump around October remains wider that recent history, but we do expect that to narrow as the US election gets closer.
Turning to short-dated index option trading, the volatile week resulted in increased premiums, but still some outlier moves relative to option pricing. Monday’s big SPX move resulted in straddle pricing over 1.00% of the index each of the following four days last week.
NDX premiums were elevated most of the week, with Monday and Thursday pricing overwhelmed by subsequent price moves.
Sometimes RUT marches to its own beat, but this past week’s action was like SPX and NDX with Monday and Thursday pricing exceeded by price action.
Price action was volatile in Europe as well, but not quite as much as in the US. Euro Stoxx 50 (SX5E) at-the-money straddle sellers did well except for Wednesday’s 2% rally.
Finally, DAX straddle sellers were the best performers in the five markets we follow, with three gains of over 100 points offsetting 85-point losses on Monday and Wednesday.


These highs and lows that occur outside regular trading hours shouldn’t be reflecting on daily, weekly, and monthly charts, but for some reason they are. This year’s low of 10.62 happened in the middle of the night and was obviously a result of wide spreads, but still shows up on charts that aren’t intraday.